Outputs
Darwin's output frameworks: pressure indicators, impact indicators, aggregated metrics, and commodity output framework.
Outputs
Pressure outputs frameworks
Key concepts and limits
- Pressure outputs frameworks are structured around pressure indicators.
- Pressure indicators are either derived from LCA databases LCI elementary exchanges (land conversion, water consumption) or LCIA midpoints (aggregated GHG emissions, aggregated acidification potential).
- Pressure indicators are compatible with SBTN frameworks and targets for ecosystem use, water use and climate change.
- The overexploitation pressure is partially covered with water use and biotic resource extraction.
- The invasive species pressure is not included in this framework and is handled through a dedicated pathway.
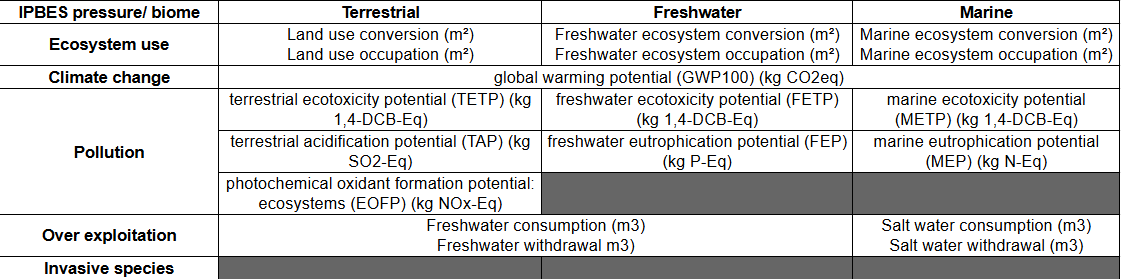
Example: summary table of pressure indicators per IPBES pressure and biomes for LCIA ReCiPe
Impact output framework
Key concepts and limits
- The impact framework is covered by several impact indicators partially covering the 3 biomes and 5 IPBES pressures (see summary table below for LCIA ReCiPe).
- The pressure-impact factors (ReCiPe, IW+, GLOBIO) translate pressure indicators into impact, therefore impact indicators of the impact framework are derived from LCIA ecosystem quality endpoints.
- Impact indicators are expressed in aggregated metrics that depend on the pressure-impact factor (species.yr, PDF.m2.yr, MSA.m2.yr) allowing comparison between the different pressures and biomes.
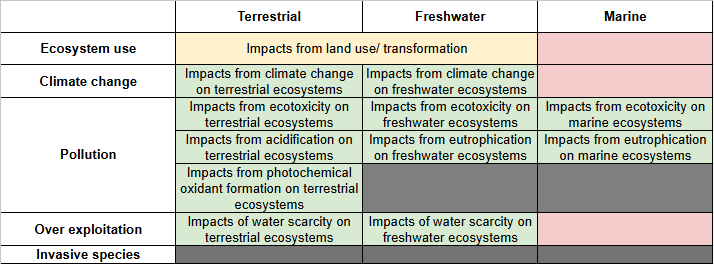
Summary table of impact indicators per IPBES pressure and biomes
Aggregated Metrics comparability
Three aggregated metrics are used across Darwin's impact frameworks to express biodiversity loss in a comparable way:
- PDF.m2.yr / PDF.m3.yr — Potentially Disappeared Fraction x area x time. Measures the fraction of species potentially disappearing in an ecosystem due to a given pressure. Used by ReCiPe and IW+ for terrestrial and aquatic/marine biomes respectively.
- species.yr — ReCiPe endpoint metric for ecosystem quality. Expresses the absolute number of species lost over time. Directly convertible to PDF using biome-specific species density values (see below).
- MSA.km2.yr — Mean Species Abundance x area x time. Measures the average decline in local species abundance relative to an undisturbed reference state (0 = fully degraded, 1 = fully intact). Used by GLOBIO.
Conversion between species.yr and PDF.m2.yr / PDF.m3.yr
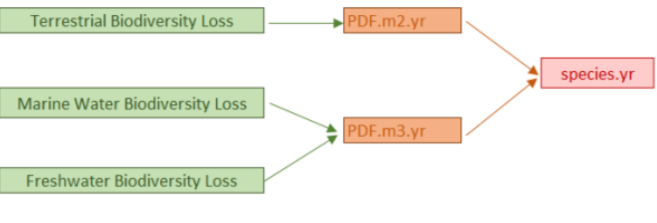
The conversion uses ReCiPe biome-specific species density values:
- Terrestrial:
PDF.m2.yr = species.yr / 1.48 x 10^-8 species/m2 - Freshwater:
PDF.m3.yr = species.yr / 7.89 x 10^-10 species/m3 - Marine:
PDF.m3.yr = species.yr / 3.46 x 10^-12 species/m3
Link between PDF and MSA
PDF and MSA capture complementary dimensions of biodiversity loss and are not directly interconvertible, but both range from 0 to 1:
- PDF (ReCiPe, IW+) measures the fraction of species at risk of local extinction — the standard metric in Life Cycle Impact Assessment (LCIA). It is well-suited for cross-pressure and cross-biome comparisons.
- MSA (GLOBIO) measures the average decline in local species abundance relative to an undisturbed state. Being abundance-based, MSA is more sensitive to changes in ecological communities than PDF, which gives it an advantage for tracking progressive biodiversity loss and recovery.
- Both metrics range from 0 to 1 but represent different ecological signals: a high PDF signals extinction risk, while a low MSA signals local community degradation — two effects that do not always coincide.
- The relationship between PDF and MSA has been shown to be broadly consistent across pressures, but with significant uncertainty (Kuipers et al., 2025; Schipper et al., 2025).
Darwin currently reports results in both metrics: PDF.m2.yr via ReCiPe and IW+, MSA.km2.yr via GLOBIO. Direct comparisons between the two should be interpreted with care given the conceptual differences.
Impact accounting (Negative / Positive, plus Avoided via scenarios)
Darwin structures biodiversity impacts using an accounting approach inspired by carbon frameworks. The two core, first-class categories reported on every footprint are:
- Negative impacts — pressures exerted on ecosystems (e.g. land-use change, pollution).
- Positive impacts — active restoration, conservation, or measurable ecological gains. Where gains are directly measured, the measured share (and the supporting technologies, e.g. eDNA or bioacoustics) can be documented alongside.
Avoided impacts work differently from the two categories above. Instead of being measured directly on the footprint, they are obtained by comparing two scenarios — what would happen without the action (a baseline) versus with it. The difference between the two is the pressure the change prevents. Darwin reports this comparison along with the main assumptions behind it.
Commodity output framework
Definition of commodity
- A commodity is a standardized economic good — typically a resource or primary product — that is fully interchangeable with goods of the same type, regardless of origin or producer.
- Commodity versus Life Cycle Inventory elementary exchanges
- Life Cycle Inventory gives lists all the elementary exchanges with the biosphere. It includes raw materials such as metals or minerals. They don't describe commodities as they are the raw form of elementary elements available in nature, not extracted and refined yet - for instance for copper: "Copper, Cu 6.8E-1%, in mixed ore, in ground"
- Commodity versus raw material
- Raw materials are natural inputs in their unprocessed state (e.g., oil, cotton, sugar), before any refining or manufacturing takes place.
- Raw materials are not commodities as they are not standardized. For instance "copper refined metal" is a raw material and "Copper,Grade A Electrolytic,Min 99.99% purity" is a commodity.
Commodity selection methodology
- The idea is to select products in ecoinvent that are the least transformed, the most standard products that are commonly traded between commodities. For instance, when available we rely on the specifications of commodity market places (such as the Chicago Mercantile Exchange specs for metal trading for instance).
- Commodity selection relies on sectoral classifications which are available in Ecoinvent:
- ISIC (International Standard Industrial Classification) rev. 4: this classification is maintained by the United Nations. Rev.4 is the fourth (and current) revision of this classification system. It classifies entities (e.g., companies, organizations) by their main economic activity (e.g., agriculture, manufacturing, services).
- CPC (Central Product Classification): also maintained by the United Nations, it classifies goods and services based on their intrinsic characteristics or nature (e.g., type of good, stage of production, functional purpose). It covers physical goods (e.g., agricultural produce, chemicals) as well as intangible services (e.g., transportation, financial services).
- For Agribalyse, sectoral classification was created.
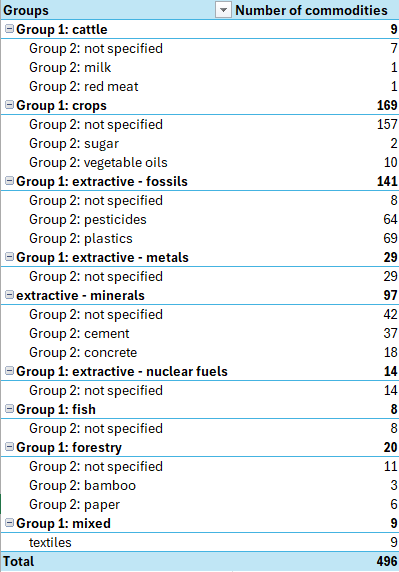
- 2 levels of commodity groups are added to facilitate results analysis and data manipulation in the platform: a broad higher-level grouping (e.g., by sector such as Agriculture or Mining) and a more granular lower-level grouping (e.g., by commodity type such as Cereals or Base Metals). This two-tier structure allows results to be aggregated or filtered at different levels of detail in the platform.