

LCIA Models
Life Cycle Impact Assessment models used in Darwin: ReCiPe 2016, Impact World+ and GLOBIO/IBIF.
Available Models
| Model | Full Name | Primary Focus | Output Unit |
|---|---|---|---|
| ReCiPe Species | ReCiPe 2016 v1.03 Endpoint | Species extinction risk | species.yr |
| ReCiPe PDF | ReCiPe 2016 v1.03 Endpoint (PDF) | Potentially Disappeared Fraction | PDF.m².yr |
| Impact World+ | IMPACT World+ v2.1 | Multi-indicator approach | PDF.m².yr |
| Impact World+ LU | IMPACT World+ v2.1 (Land Use) | Land use specific | PDF.m².yr |
| GLOBIO | GLOBIO 4 / IBIF v2 | Global biodiversity model | MSA.km² |
| GLOBIO Extended | GLOBIO 4 Extended / IBIF v2 | Enhanced GLOBIO | MSA.km² |
Model Selection
Choose your impact model when creating a project. Consider:
| Factor | Consideration |
|---|---|
| Assessment scope | Company-wide vs. product-specific |
| Key pressures | Land use vs. pollution focus |
| Reporting needs | Which frameworks you're reporting to |
| Data availability | What data you have available |
ReCiPe Species is the default model and is recommended for most assessments as it provides a balanced view of all pressure types.
Key concepts
- LCIA interprets the LCI data by associating emissions and resource uses with specific impact categories.
- Typical impact categories include global warming potential (GWP), acidification, eutrophication, ozone depletion, photochemical smog, human toxicity, and eco-toxicity, among others.
- The inventory flows (e.g., 1 kg CO2, 0.01 kg SO2) are multiplied by characterization factors that quantify their contributions to each impact category (e.g., global warming, acidification).
- This phase provides an environmental profile of a product or service, showing "where" and "how much" environmental damage could occur based on the known impacts of each flow.
ReCiPe 2016 v1.03 (hierarchist)
ReCiPe is a widely used Life Cycle Impact Assessment (LCIA) method developed through a collaboration of Dutch and Swiss institutions (including RIVM, PRe Sustainability, CML, and ETH). It translates LCI results into environmental impact indicators at both midpoint (environmental problem-oriented) and endpoint (damage-oriented) levels.
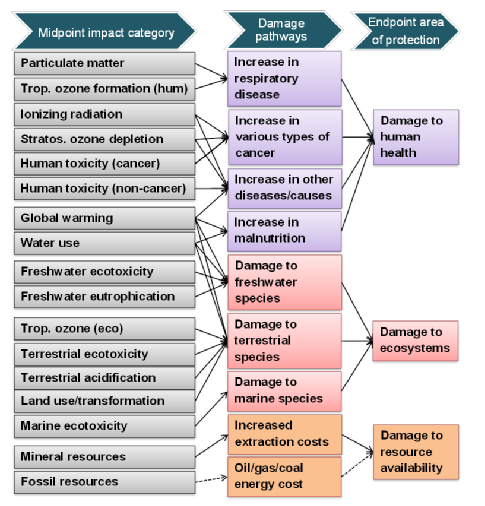
- Midpoint indicators represent environmental impacts in relatively early stages of cause-effect chains (e.g., climate change as measured by kilograms of CO2-equivalent, eutrophication potential in kg phosphate-equivalent).
- Endpoint indicators aggregate midpoint impacts into higher-level areas of protection, typically focusing on three areas:
- Human health (e.g., disability-adjusted life years lost)
- Ecosystems (e.g., loss of species diversity)
- Resource availability (e.g., fossil resource scarcity)
To account for different assumptions about environmental mechanisms and time horizons, ReCiPe typically offers three cultural perspectives: Hierarchist (H), Egalitarian (E), and Individualist (I). These perspectives differ in how conservatively or progressively they interpret scientific uncertainty and time horizons.
Overview of structure ReCiPe
Specifics of ReCiPe 2016 v1.03
ReCiPe 2016 is the updated version of the original ReCiPe 2008 method. Version 1.03 (often referred to as ReCiPe 2016 v1.03) introduces refinements and methodological improvements based on new scientific insights and better characterization modeling.
Key features and updates include:
-
Refined impact categories
- The number and definitions of midpoint impact categories were updated to reflect scientific progress. Common midpoint categories in ReCiPe 2016 include climate change, particulate matter formation, photochemical oxidant formation, acidification, eutrophication, water use, land use, and resource use (minerals and fossil resources), among others.
-
Updated characterization models
- ReCiPe 2016 v1.03 integrates the latest models for characterizing impacts such as climate change and human toxicity. This means more accurate factors for converting emissions (e.g., CO2, methane, heavy metals) into their respective impacts.
-
Enhanced endpoint calculations
- Endpoints (damage to human health, ecosystems, and resource availability) are updated to align with refined midpoint calculations, ensuring consistency from midpoint to endpoint results.
-
Consistent cultural perspectives
- As with earlier ReCiPe versions, three perspectives (I, H, E) are retained, allowing users to select the level of uncertainty acceptance and time horizon. Version 1.03 further clarifies these perspectives and ensures each perspective is tied to the most up-to-date science.
-
Improved documentation and data quality
- Version 1.03 comes with updated documentation describing how characterization factors are derived. This helps LCA practitioners follow transparency guidelines and understand the methodology behind each impact calculation.
-
Alignment with international standards
- ReCiPe 2016 v1.03 continues to follow recognized LCA standards (e.g., ISO 14040/44). This ensures methodological coherence and acceptance in both academic and industry settings.
Overall, ReCiPe 2016 v1.03 offers a robust, science-based approach for converting life cycle inventory data into clear, comparable impact indicators. By integrating the latest research, users gain a more comprehensive understanding of potential environmental burdens and damages, facilitating better-informed decisions about product design, process optimization, and policy-making.
Impact World+
What is Impact World+?
- Impact World+ (IW+) is a globally applicable LCIA method developed by CIRAIG (International Reference Centre for the Life Cycle of Products, Processes and Services), based at Polytechnique Montreal, in collaboration with a network of international research partners.
- It was designed to overcome key limitations of earlier LCIA methods by providing improved spatial differentiation, a broader set of impact categories, and stronger alignment with current scientific knowledge on biodiversity and ecosystem functioning.
- IW+ is particularly recognized for its treatment of freshwater, land use, and biodiversity impacts, making it especially well-suited for assessing agri-food and land-intensive supply chains.
Midpoint and endpoint structure
- Like ReCiPe, IW+ operates at two levels:
- Midpoint indicators reflect environmental impacts at intermediate stages of the cause-effect chain (e.g., climate change in kg CO2eq, water consumption in m3). They are closer to the inventory and carry less uncertainty.
- Endpoint indicators aggregate midpoint results into damage to three areas of protection:
- Human health (expressed in Disability-Adjusted Life Years, DALYs)
- Ecosystem quality (expressed in PDF.m2.yr for terrestrial and freshwater, and PDF.m3.yr for marine ecosystems)
- Resource availability (expressed in surplus cost, USD)
- IW+ provides standalone midpoint-only factors as well as full midpoint-to-endpoint characterization, giving practitioners flexibility depending on study goals.
Key differentiating features
- Spatial differentiation: IW+ provides spatially differentiated characterization factors for several impact categories (particularly land use, water use, and particulate matter), allowing results to vary by region or even watershed. This is a major advantage over globally uniform methods.
- Marine eutrophication and ecotoxicity: IW+ includes dedicated marine endpoint factors, improving coverage of ocean-related pressures.
- Freshwater biodiversity: IW+ offers some of the most refined freshwater ecosystem quality characterization factors available, grounded in species sensitivity distributions (SSDs) and empirical biodiversity data.
Specificities of Impact World+ as used in darwin
Version context
- Darwin uses Impact World+ v2.1, the most recent stable release of the method, incorporating the latest updates to characterization factors and impact category coverage.
Key updates and features of v2.1
-
Updated land use characterization factors
- Revised factors based on global species richness datasets, distinguishing between land occupation and land transformation impacts for terrestrial and freshwater biomes.
- Improved alignment with ecoinvent land use elementary flows, ensuring better coverage of ecosystem use types in darwin's pressure framework.
-
Refined water scarcity factors
- Updated regionalized water scarcity characterization factors based on the AWARE (Available WAter REmaining) model, providing country- and watershed-level differentiation.
- Separate factors for human health and ecosystem quality endpoints.
-
Expanded ecotoxicity coverage
- Updated freshwater and marine ecotoxicity characterization factors, based on the latest USEtox model parameters and empirical SSD data.
-
Improved climate change endpoint factors
- Revised damage factors for human health and ecosystem quality, reflecting updated dose-response relationships and climate sensitivity estimates.
-
Harmonized elementary flow nomenclature
- IW+ v2.1 factors are mapped to the ecoinvent 3.x elementary flow list, ensuring seamless integration with LCI databases used in darwin (ecoinvent 3.10 and Agribalyse 3.1).
Output metric: PDF.m2.yr
- IW+ expresses ecosystem quality impacts in PDF.m2.yr, representing the Potentially Disappeared Fraction of species per square meter per year, across all biomes (terrestrial, freshwater and marine).
- This metric is not directly comparable to the species.yr metric used in ReCiPe, as they differ in both the reference unit and the underlying species density assumptions.
GLOBIO / IBIF
What is GLOBIO?
- GLOBIO is a global biodiversity model developed by PBL Netherlands Environmental Assessment Agency (PBL) in collaboration with Radboud University and an international network of partners. It quantifies local biodiversity intactness using the Mean Species Abundance (MSA) metric, a dimensionless indicator ranging from 0 (full loss of original species assemblage) to 1 (fully intact community).
- Unlike PDF-based methods (ReCiPe, IW+), MSA is based on species abundance rather than species disappearance probability, making it more sensitive to gradual changes in ecological communities and better suited for tracking ongoing losses and gains in biodiversity intactness.
- GLOBIO is widely recognized as the scientific basis of the GLOBIO3 and GLOBIO4 models, and is aligned with the biodiversity modeling framework used in global assessments such as those of IPBES.
What is IBIF?
- The Intactness-Based Biodiversity Impact Factors (IBIF) dataset (Schipper et al., 2025, Scientific Data) is a consistent set of country-level characterization factors derived from GLOBIO 4, designed to quantify terrestrial biodiversity footprints in the context of LCA and EEMRIO analyses.
- IBIF provides impact factors (BIFs) for 234 countries and five environmental pressures: CO2 emissions, NH3 emissions, NOx emissions, land use (urban land, cropland, pasture, forest plantations, mines) and roads.
- BIFs are available separately for vascular plants and warm-blooded vertebrates (birds & mammals), as well as a combined average across both groups.
- The dataset is available on Zenodo and its model code is open-source.
Midpoint and endpoint structure
- GLOBIO operates exclusively at the endpoint level: it directly quantifies the loss in local community intactness, without an intermediate midpoint stage.
- The output metric is MSA-loss . km2 . yr, representing the area- and time-integrated loss of mean species abundance.
- This metric is not directly comparable to the species.yr (ReCiPe) or PDF.m2.yr (IW+) metrics, as it is based on a different biological concept (abundance rather than disappearance fraction) and a different spatial aggregation logic. Darwin reports GLOBIO results separately from ReCiPe and IW+ outputs.
Key differentiating features
- MSA metric: grounded in empirical meta-analyses of species abundance responses to multiple pressures, MSA captures community-level intactness including sub-lethal effects on populations, which PDF does not.
- Country-level spatial differentiation: BIFs vary by country, reflecting differences in ecosystem type composition, baseline pressure levels, and atmospheric transport of nitrogen. This is particularly pronounced for nitrogen emissions, where countries with large areas of natural vegetation and low baseline deposition (e.g. Canada, Russia) have significantly higher BIFs than densely populated, heavily fertilized regions.
- Pressure coverage: GLOBIO covers climate change (via CO2 and GHG emissions), nitrogen deposition (NH3 and NOx), habitat loss, habitat fragmentation and habitat disturbance due to land use and roads. It does not currently cover water-related pressures or marine and freshwater biomes, limiting its scope to terrestrial ecosystems only.
- Two taxonomic groups: BIFs are provided separately for plants and warm-blooded vertebrates, allowing users to analyse differential impacts across taxa.
Specificities of GLOBIO / IBIF as used in darwin
Version context
- Darwin uses the IBIF dataset version 2 (Schipper et al., 2025), derived from GLOBIO version 4.3.1, with input data representative of the year 2020.
Key methodological choices and updates in IBIF v2
-
Revised land use impact relationships
- Habitat loss relationships were refitted by pooling data across land-use intensity levels and aggregating into four land-use types (urban land, cropland, pasture, forest plantations), improving statistical robustness for land-use types with small sample sizes in earlier versions.
- Mines were added as a separate land-use category, with complete biodiversity loss assumed at extraction sites (MSA = 0) and habitat disturbance effects modelled within a 5 km impact zone.
-
Exclusion of direct exploitation
- Hunting and direct exploitation were excluded from IBIF because of difficulties in attributing impacts to specific economic activities in LCI or EEMRIO data.
-
Updated input data (2020 baseline)
- Climate: global mean temperature increase of 1.26 degrees C relative to pre-industrial levels (MAGICC6 model).
- Nitrogen deposition: global gridded maps at 0.125 degrees resolution (Zhu et al., 2025).
- Land use: ESA CCI land cover map (2020) combined with FAOSTAT country-level data for pasture and plantation forest.
- Roads: Global Road Inventory Project (GRIP) database, road types 1-3 only (highways, primary and secondary roads).
-
Atmospheric transport of nitrogen modelled via TM5-FASST
- NH3 and NOx BIFs account for transboundary nitrogen deposition using source-receptor matrices from the TM5-FASST atmospheric transport model (56 world regions), meaning that countries within the same TM5-FASST region share the same BIF for nitrogen emissions.
-
Time horizon for CO2 emissions
- BIFs for CO2 are based on a 100-year time horizon (IAGTP100 = 47.6 x 10^-15 degrees C.yr.kg^-1 CO2), consistent with standard IPCC conventions. Conversion factors are provided in the IBIF dataset to adapt to other time horizons or other greenhouse gases (CH4, N2O).
Coverage limits in darwin
- GLOBIO / IBIF covers terrestrial ecosystems only. Freshwater and marine biomes are not covered, which is a significant limitation compared to ReCiPe and IW+.
- Road impacts are currently not integrated in darwin's pressure framework, as they require specific fuel-use data per transport activity that is not systematically available in LCI databases.
- GLOBIO uses universal MSA impact relationships (i.e., the same response curve applies globally for a given pressure), meaning that spatial differences in species richness and community composition across the globe are not captured. Darwin highlights this limitation in results displays and recommends using GLOBIO alongside ReCiPe or IW+ for a more comprehensive biodiversity assessment.
Understanding Output Units
PDF.m².yr
Potentially Disappeared Fraction of species × Area × Time
- Represents the fraction of species potentially lost
- Multiplied by the area affected
- Over a time period (usually one year)
Interpretation: A value of 100 PDF.m².yr means an impact equivalent to completely eliminating biodiversity from 100 m² for one year.
MSA.km²
Mean Species Abundance × Area
- MSA ranges from 0 (no species) to 1 (pristine)
- Multiplied by the area affected
Interpretation: A loss of 1 MSA.km² means reducing the MSA by 1 (from pristine to none) across 1 km², or reducing MSA by 0.5 across 2 km².
Comparing Models
Different models may give different absolute values for the same activity. However:
- Rankings are generally consistent: Higher-impact activities score higher across models
- Relative comparisons are valid: Comparing scenarios within the same model is reliable
- Trend analysis works: Tracking change over time is meaningful
Avoid comparing absolute values between different impact models. The units and methodologies differ significantly.
Model Versions
| Model | Current Version | Reference |
|---|---|---|
| ReCiPe | 2016 v1.03 (hierarchist) | Huijbregts et al. (2017) |
| Impact World+ | v2.1 | CIRAIG |
| GLOBIO / IBIF | IBIF v2 (GLOBIO 4.3.1) | Schipper et al. (2025) |
Recommendations by Use Case
General Corporate Assessment
Recommended: ReCiPe Species
- Comprehensive coverage of all major pressures
- Well-established methodology
- Suitable for TNFD/CSRD reporting
Agricultural Supply Chain
Recommended: Impact World+ LU
- Detailed land use characterization
- Regional differentiation
- Commodity-specific factors
Policy and Scenario Analysis
Recommended: GLOBIO
- Intuitive MSA metric
- Pressure-response clarity
- Spatial visualization
Financial Portfolio Screening
Recommended: ReCiPe Species or GLOBIO
- Comparable across sectors
- Communication-friendly metrics
- Alignment with emerging standards