

Key Concepts
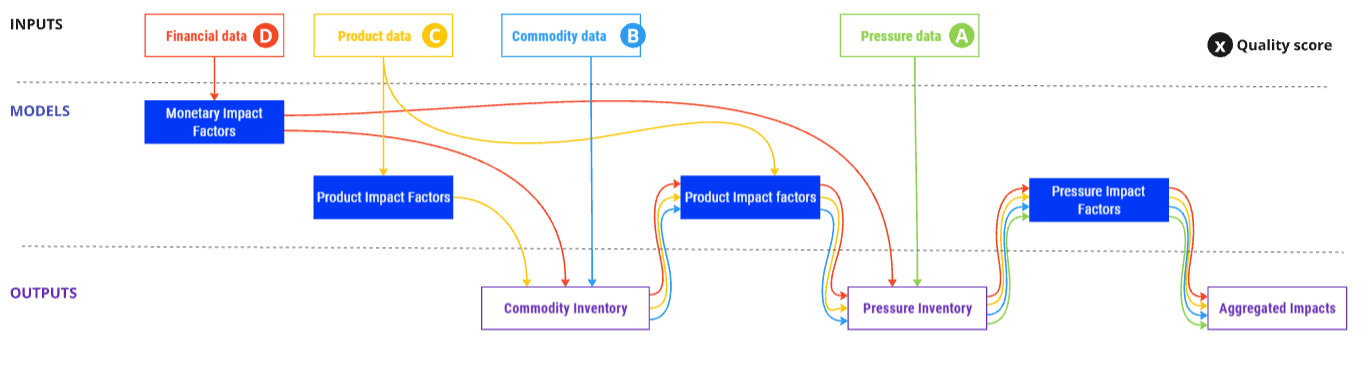
Overview of Darwin's biodiversity impact factors: input data types, factor types, and outputs.
Key concepts
This section describes how Darwin builds its biodiversity impact factors — the factors that transform company input data into biodiversity outcomes.
Input data
Darwin's impact assessment handles 5 types of input data:
- Financial data — turnover, sales or procurement data (currency)
- Product data — transformed materials & goods (weight or volume)
- Commodity data — subset of product data, raw materials that are standardized and tradable (weight or volume)
- Pressures data — physical flows driving biodiversity loss across the 5 IPBES pressures (e.g. m³ water, km²)
- Sites location data — geographic coordinates or addresses of operational sites; used in impact assessment when regionalized impact factors are available
Impact factors
Three types of impact factors transform input data into biodiversity outcomes:
- Monetary impact factors — translate financial data using EXIOBASE
- Product impact factors — translate product data using Ecoinvent and Agribalyse
- Pressure impact factors — translate pressures using ReCiPe, IW+ and GLOBIO.
Some factors are regionalized; when input data includes geographic information, regionalized factors can be applied.
Outputs
Monetary and product impact factors produce all three output types; pressure impact factors produce pressures and aggregated impacts only.
- Commodities inventory — raw materials associated with business activities (e.g. wheat, crude palm oil, copper)
- Pressures inventory — physical flows driving biodiversity loss (e.g. land occupation: 5,000 km2, water consumption: 10,000 m3)
- Aggregated impacts — quantified biodiversity effects expressed in species.yr (ReCiPe), PDF.m2.yr (IW+) or MSA.m2.yr (GLOBIO)
Modeling routes are summarised below.
How the final scope is determined
Every result is reported under a value-chain scope — Scope 1 (own operations), Scope 3 upstream or Scope 3 downstream. The scope a result lands in depends on both the input point's own declared scope and the value-chain position of the entity it belongs to.
Entities carry a position in the value chain: the company root and sites always represent own operations (Scope 1), while organisation units can be positioned as own operations, upstream or downstream. The entity position acts as a ceiling:
- On an own-operations entity, the result keeps the input point's declared scope.
- On an upstream entity (suppliers), every result is reported under Scope 3 upstream, whatever scope the input was tagged with.
- On a downstream entity (clients, distribution), every result is reported under Scope 3 downstream.
| Entity position | Input point scope | Reported scope |
|---|---|---|
| Own operations | Scope 1 | Scope 1 |
| Own operations | Scope 3 upstream | Scope 3 upstream |
| Own operations | Scope 3 downstream | Scope 3 downstream |
| Upstream (supplier) | any | Scope 3 upstream |
| Downstream (client) | any | Scope 3 downstream |