

Changing wind patterns
How Darwin prices the change of a wind plant's annual energy when the mean wind changes, a loss or a gain.
Changing wind patterns
Climate change shifts the average wind, not only its extremes. A wind plant's output follows the wind closely, so a slower mean wind makes less energy every year, and a faster one makes more. Changing wind patterns prices Business interruption only (% of annual revenue), and it is the one risk whose figure is signed: more wind is a gain, shown as a negative loss. It reaches wind plants only: every other site type reads 0. It reads the mean wind, so it does not price the storms that Cyclone and Extra-tropical windstorm price.
What the map shows
- Today: the Weibull scale of the wind at 100 m from the Global Wind Atlas v4, on a 1 km grid: the onshore wind level the engine starts from.
- Projected: a second raster shows the change of the mean wind at 10 m per scenario and horizon, as a ratio to 1995-2014 (1 = no change). 2035 reads the 2021-2040 window, 2050 reads 2041-2060 and 2080 reads 2081-2100. Each scenario reads its own run (SSP1-2.6, SSP2-4.5, SSP3-7.0), on a 10 km grid resampled from 1°.
How the loss is computed
The engine reads the Global Wind Atlas Weibull wind at the site (scale A and shape k): at 100 m for an onshore plant, at 150 m for an offshore one. It computes the capacity factor of a reference turbine on that wind, then again with the mean wind scaled by the projected ratio r. The share of annual energy lost is 1 − CF(r·A, k) / CF(A, k), and revenue is taken as proportional to energy. Today the ratio is 1, so the baseline loss is 0 and the figure is the change itself. Where the Global Wind Atlas has no data (open ocean beyond about 200 km, Antarctica), the engine returns no row rather than a zero. The hazard is tagged Proposal. See Damage function below and Climate risks.
Damage function
The figure has one panel, business interruption, on a symmetric axis around 0: below 0 is a gain. One line per asset group, as in the conventions on Damage functions.
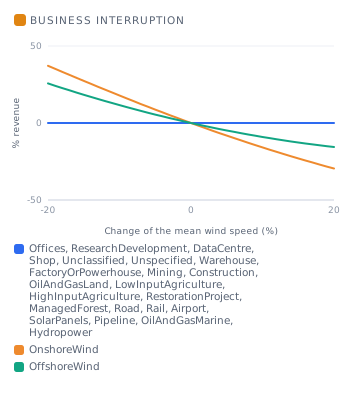
| Intensity axis | Change of the mean wind speed at the horizon (%), from the C3S Atlas CMIP6 ensemble-median ratio |
| Business interruption | 1 − CF(r·A, k) / CF(A, k): the share of the plant's annual energy lost, where CF is the capacity factor of an IEA reference turbine on a Weibull wind (A, k from Global Wind Atlas v4 at hub height) and r the mean-wind ratio |
| Darwin's part | The turbine per site type (onshore: IEA 3.4 MW on the 100 m wind; offshore: IEA 15 MW on the 150 m wind); a parametric power curve standing in for the published ones; revenue taken as proportional to energy. Every other site type reads 0. This hazard is a proposal |
The curves are drawn at the median wind climate of mapped wind plants (onshore A 8.33 m/s, k 2.25; offshore A 11.17 m/s, k 2.37). A site's own curve depends on its local A and k: an offshore plant, on a stronger wind, is about half as sensitive as an onshore one. The ratio scales the mean wind and holds the shape k, because the climate models give the change of the mean, not of the spread. The curve gives the change of one year's energy at the horizon's climate, not an annual loss integrated over events.
Sources
- Global Wind Atlas v4, Weibull
Aandkat 100 m and 150 m (DTU Wind Energy and World Bank Group), block-averaged to 1 km. The World Bank catalogue lists the Global Wind Atlas under CC BY 4.0; that listing describes version 3, and the licence of version 4 is being confirmed. - Multi-origin C3S Atlas (Copernicus Climate Change Service), CMIP6
sfcWind, median of the members common to the historical and scenario runs (24 members, 23 for SSP2-4.5). CC BY 4.0. - Turbines: the IEA Wind TCP Task 37 reference turbines, 3.4 MW land-based and 15 MW offshore.
Limits
- The power curve is a parametric stand-in (cubic from cut-in to rated, flat to cut-out), not the tabulated curves of the two reference turbines, and its parameters are not yet checked against the IEA reports. An older, higher specific-power turbine would raise the loss by 30-40 %.
- The ratio is measured at 10 m and applied at hub height, which assumes the wind shear does not change. Hahmann et al. (2022) show this can overstate the future change.
- The change field is 1° wide: it says nothing about local channelling or valley effects.
- Before 2080, most of the land change is inside the spread of the climate models: across the land surface, under SSP3-7.0, the change is robust on 2 % of the area at 2035, 7 % at 2050 and 25 % at 2080 (IPCC AR6 robustness test). The map does not mark it yet. At 2035 the scenarios are not ordered (SSP1-2.6 can read a larger loss than SSP3-7.0): that is natural variability in the ensemble median, not a forcing signal.
- Revenue is taken as proportional to energy: price, curtailment and contract floors are not modelled.
- A gain is not graded: the loss grade on business interruption is withheld because the share is signed, and a gain would grade low, the grade of a small loss.